Submitted graphic
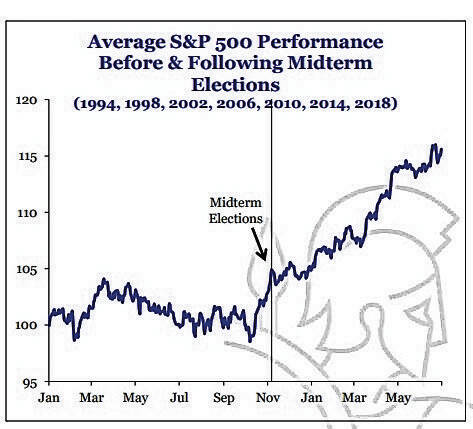
Graphic provided An illustration from Jason DeSena Trennert, founder of Strategas Research Partners, who examined returns for the S&P 500 during MTEYs going back to 1994.
Seasonal tendencies of stock prices make for interesting conversation. Pundits offer the brilliant advice of “Sell in May and Go Away,” which means liquidate your portfolio to avoid a summer/fall swoon. Heeding this, you must then reverse course and be completely reinvested in time to catch the “Santa Claus Rally,” the market’s holiday gift to investors.
A more persistent seasonal anomaly is the “Presidential Cycle,” a pattern of stock performance coinciding with various years of a presidency. In particular, Year 2 of a presidency is a Midterm Election Year (“MTEY”), with Congressional elections held in November. Historically, stock prices have been 1) weaker in MTEYs (median annualized return of 3.1% for the Dow Jones Industrial Average going back to 1900) than in Years 1 (12.7%), 3 (14.8%) or 4 (7.4%) of a Presidential Cycle, but 2) stronger in the months immediately following the election itself.
This is a MTEY, with all 435 seats in the U.S. House of Representatives and 35 of the 100 seats in the U.S. Senate up for election on Tuesday, Nov. 8. The U.S. President’s party almost always loses seats in Congress. In the 22 mid-term elections going back to 1934, the president’s party has lost an average of 28 seats in the House and four in the Senate.
The president’s party losing seats is generally the expected outcome, but uncertainty regarding the magnitude of the loss and resulting impact on governing between the executive and legislative branches has tended to both depress prices and increase volatility in the months leading up to the election. Investors hate uncertainty and typically respond to a perceived increase in risk by selling stocks.
In “Asset Prices, Midterm Elections and Political Uncertainty, published in July 2021 in the Journal of Financial Economics, professors Kam Fong Chan of the University of Western Australia and Terry Marsh of the University of California, Berkley determined, “U.S. equity premiums over the last 145 years average 15.41% annualized in months following midterm elections, yet only 2.98% in other months. The 12.43% annualized premium difference is both statistically and economically significant.”
Chan and Marsh said while uncertainty as to Executive-Legislative cooperation and ensuing legislative prospects are steadily resolved (post-election), “all policy uncertainty does not instantaneously disappear.” Indeed, the empirical evidence indicates “higher stock prices are realized over a sequence of post-midterm months.”
Of course, MTEYs are not identical. In 2022, we’ve had 1) the fifth worst first-half return for the S&P 500 since 1932 due to, 2) soaring inflation leading to, 3) aggressive rate-tightening by the Fed, leading to 4) fears of a recession. Add the ongoing war in Ukraine to the mix and you have some of the lowest readings of consumer/investor confidence in history.
History says, but does not guarantee, stocks will continue to recover from their first-half swoon. Sam Stovall, Chief Investment Strategist of CFRA notes of the 16 quarters of the Presidential Cycle, Q3 (the current quarter) has been the most volatile and only the second average decliner (along with Q2). However, Q4 (along with the first two quarters of the following year) have been the strongest of all 16 quarters.
Mickey Kim is the chief operating officer and chief compliance officer for Columbus-based investment adviser Kirr Marbach & Co. Kim also writes for the Indianapolis Business Journal. He can be reached at 812-376-9444 or [email protected].


